



Area Highlights
A quick view of the most influential metrics in Denville.
Learn more about Denville
Denville, NJ Market Snapshot (GSMLS & Public Records)
Research reviewed September 16, 2026. Each table identifies its own reporting period and source.
This Denville real estate market report brings together a recent quarterly snapshot, historical sales activity, state residential benchmarks, and documented home sales. The separate datasets are presented independently so buyers and sellers can distinguish current-period activity from longer-term context.
Second Quarter 2026: April 1–June 30
Coverage: single-family homes, townhomes, and condominiums reported in the cited GSMLS-backed publication.
Noteworthy Market Trends
- Higher second-quarter median: The reported median rose approximately 27.4% from Q2 2022 to Q2 2026, calculated from the publisher’s rounded figures.
- Annual sales volume varied: The county-record series shows 407 home sales in 2021, 222 in 2023, and 274 in 2024. The 2024 count rebounded approximately 23.4% from 2023 but remained approximately 32.7% below 2021.
- Higher state-reported average: Denville’s average sale price in the state’s residential statistics increased from $525,657.28 in the 2022 publication to $697,051.48 in the 2025 publication, a 32.6% increase in the reported average—not a measure of appreciation for the same homes.
Market Insight
For buyers researching homes for sale in Denville, NJ, townwide statistics are a starting point rather than a property valuation. Compare homes with similar locations, legal uses, sizes, conditions, and lot characteristics. Where association obligations or lake-access rights apply, review those separately instead of assuming that two similarly priced properties provide the same ownership experience.
For sellers, recent comparable closings and directly competing listings are more useful for setting an asking price than a broad municipal average alone. A change in average or median sale price can reflect which properties sold, as well as changing market conditions. Historical high-priced transactions establish what particular homes achieved at particular times; they do not establish the present value of another property.
Denville Five-Year Comparison: Second Quarter 2022–2026
| Period | Closed Sales | Median Price | Average Price | Average DOM |
|---|---|---|---|---|
| Q2 2026 | 55 | $688K | $755K | 22 |
| Q2 2025 | 49 | $675K | $744K | 34 |
| Q2 2024 | 56 | $663K | $674K | 22 |
| Q2 2023 | 59 | $590K | $626K | 21 |
| Q2 2022 | 67 | $540K | $589K | 32 |
Source: Sotheby’s International Realty / Kienlen Lattmann, using Garden State MLS data. Updated July 6, 2026; closing-date cutoff June 30, 2026. Prices are rounded. DOM measures listing to accepted offer and signed contract. These are quarterly, not annual, figures.
Denville Annual Home Sales: 2015–2024
The following ten-year series comes from the Denville Township School District’s 2025 demographic study, using Morris County Tax Board records and excluding what the study calls “paper sales.” It is a county-record home-sales series, not an NJMLS listing-outcome report.
| Year | Home Sales in the Study |
|---|---|
| 2024 | 274 |
| 2023 | 222 |
| 2022 | 255 |
| 2021 | 407 |
| 2020 | 336 |
| 2019 | 271 |
| 2018 | 318 |
| 2017 | 317 |
| 2016 | 315 |
| 2015 | 293 |
Source: Denville Township School District Demographic Study, April 2025, Figure 29, page 64. This series ends in 2024; figures from other datasets have not been appended to it.
Denville Residential Benchmarks: State Publications 2022–2025
The New Jersey Division of Taxation publishes separate residential statistics for Denville Township, municipality code 1408. “Report year” below refers to the publication label. The sales counts and prices follow the state’s dataset and should not be treated as complete calendar-year MLS totals or combined with the preceding county-record counts.
| Report Year | Sales in State Table | Average Sale Price | Average Assessment | Average Tax Bill |
|---|---|---|---|---|
| 2025 | 166 | $697,051.48 | $410,847 | $11,459 |
| 2024 | 169 | $628,673.96 | $409,344 | $11,282 |
| 2023 | 172 | $580,738.25 | $410,125 | $10,848 |
| 2022 | 260 | $525,657.28 | $409,124 | $10,523 |
Source: New Jersey Division of Taxation, Average Residential Statistics; each report year links to its source. An assessed value is not a market-value estimate. The municipal average tax bill is not a quote for an individual property or a prediction of its future taxes.
Selected Denville, NJ Single-Family Home Sales
These five documented transactions provide examples of higher-priced Denville home sales. They are arranged by sale price within this selection, not presented as the township’s all-time top five or top ten.
| Property | Reported Sold Date | Sold Price |
|---|---|---|
| 12 Harvest Way | April 14, 2025 | $2,726,888 |
| 529 Openaki Road | June 30, 2026 | $1,800,000 |
| 7 Cedar Gate Road | April 17, 2025 | $1,550,000 |
| 9 Melissa Drive | July 10, 2025 | $1,425,000 |
| 32 Seneca Trail | June 27, 2023 | $1,300,000 |
Source: the linked public property histories. Dates use the GSMLS sold events shown in those histories. A public-record date or another MLS feed can differ. These examples are not a comprehensive sales search and do not establish record-sale rankings. MLS identifiers and buyer information are excluded.
How to Use This Report
Compare like with like. Use the second-quarter series for same-season comparisons, the county-record series for its stated annual home-sale counts, and the state publications for their separately defined benchmarks.
Evaluate the individual property. Match recent comparable sales by location, size, condition, legal configuration, lot characteristics, and ownership requirements. Account for differences before drawing a pricing conclusion.
Keep historical results separate from current availability. The sold properties above are historical examples, not homes being advertised as currently available. Neither historical sale prices nor municipal averages guarantee a future transaction result.
Methodology: This is a public-source Denville market report, not an NJMLS Statistics Report. GSMLS, county-record, state tax-administration, and individual property-history data have different coverage and reporting conventions. Percentage changes identified as calculations use the displayed source figures. No annual NJMLS success ratio, sale-to-original-list-price series, or all-time sales ranking is asserted.
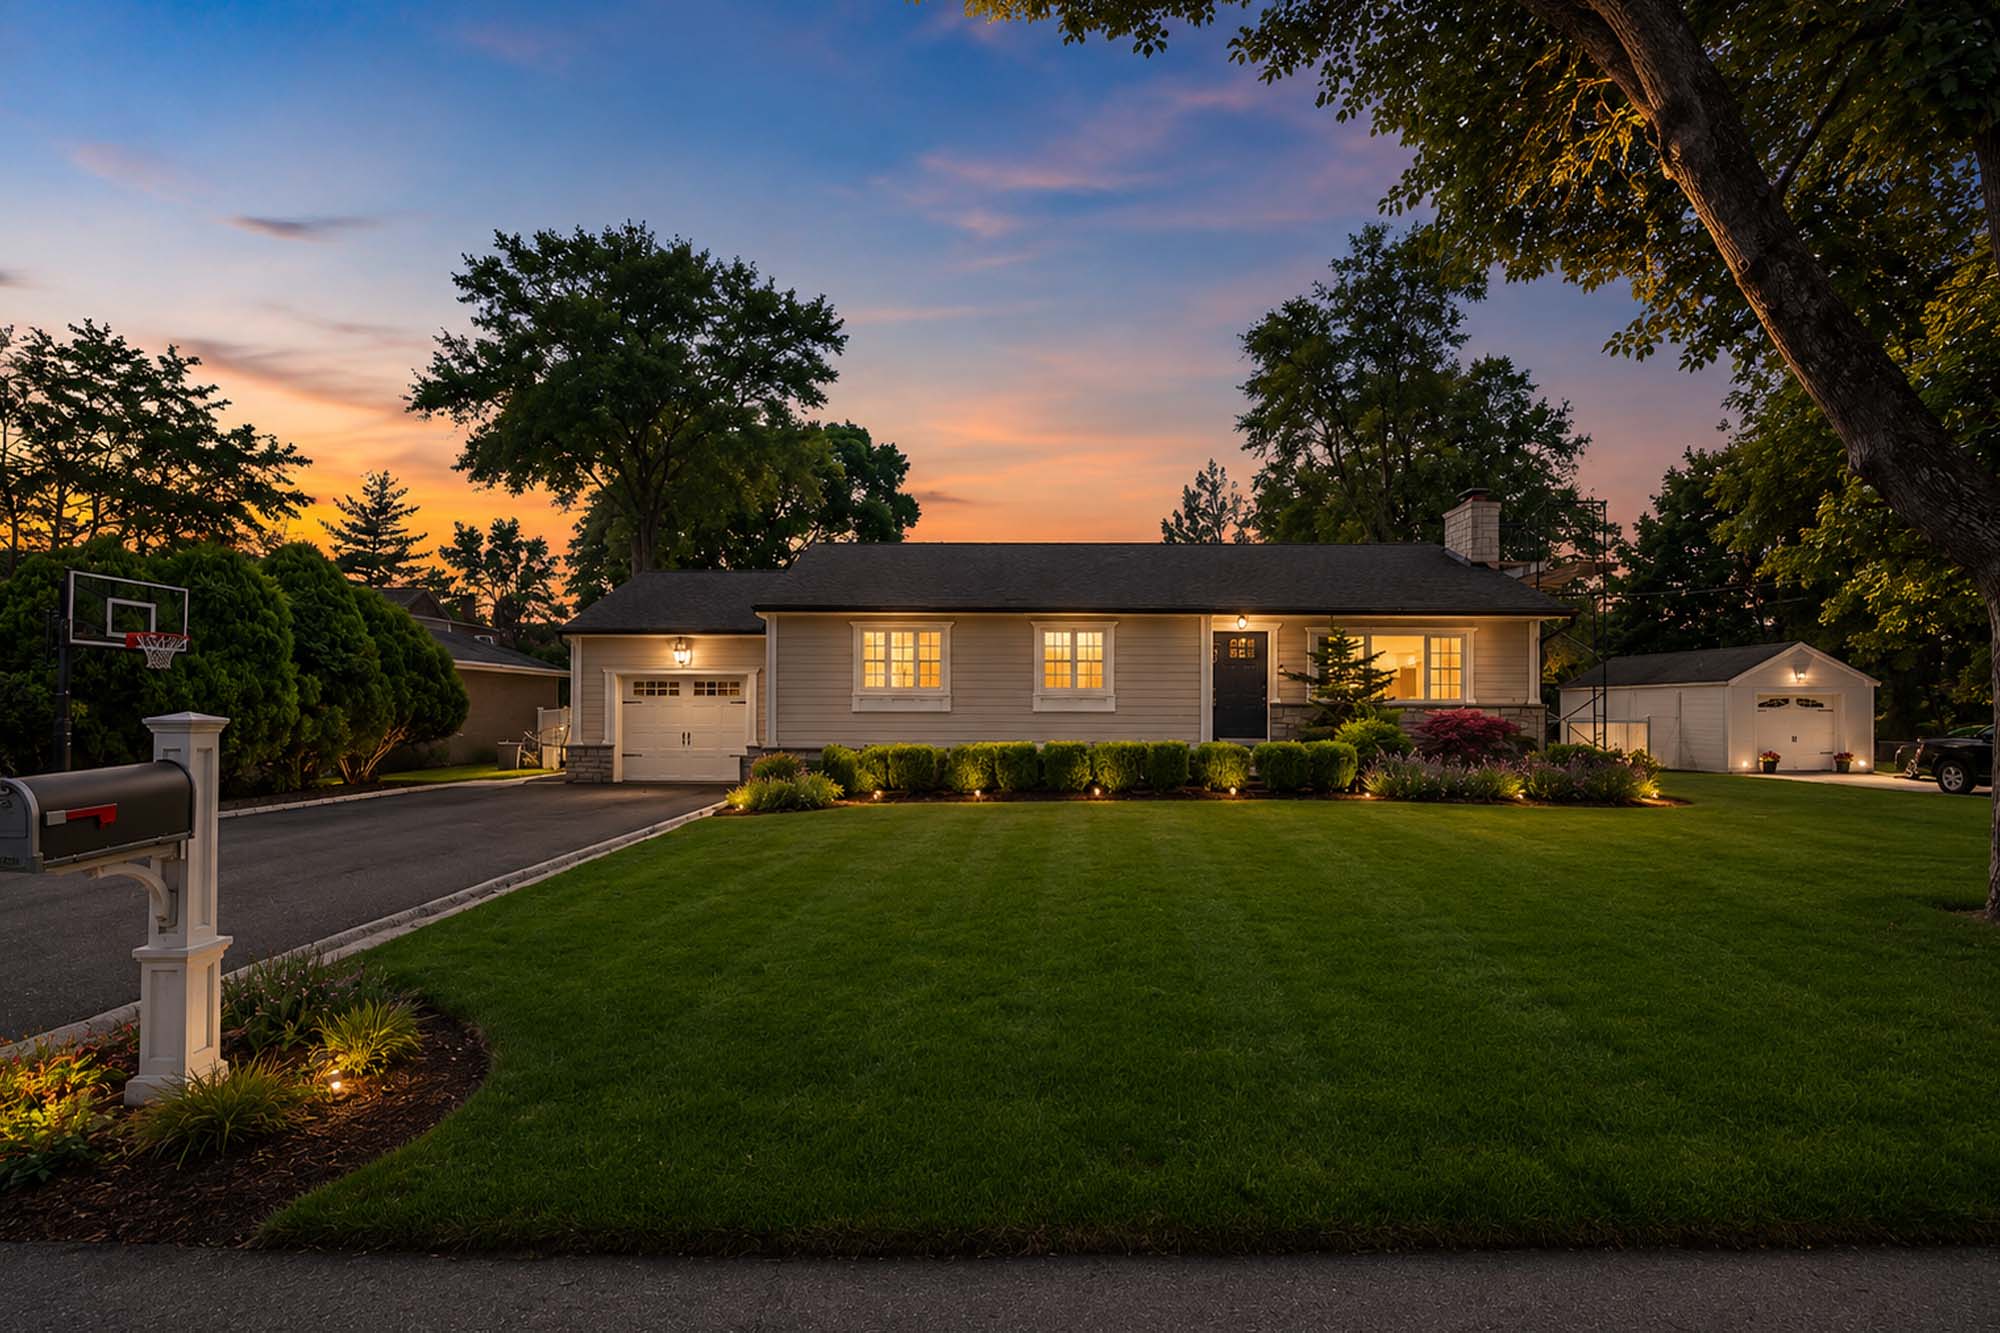
Daily Voice Features NJ Proper’s $910,000 …
MIDLAND PARK, NJ — A renovated two-bedroom ranch has become a headline-making sale in Bergen County.…
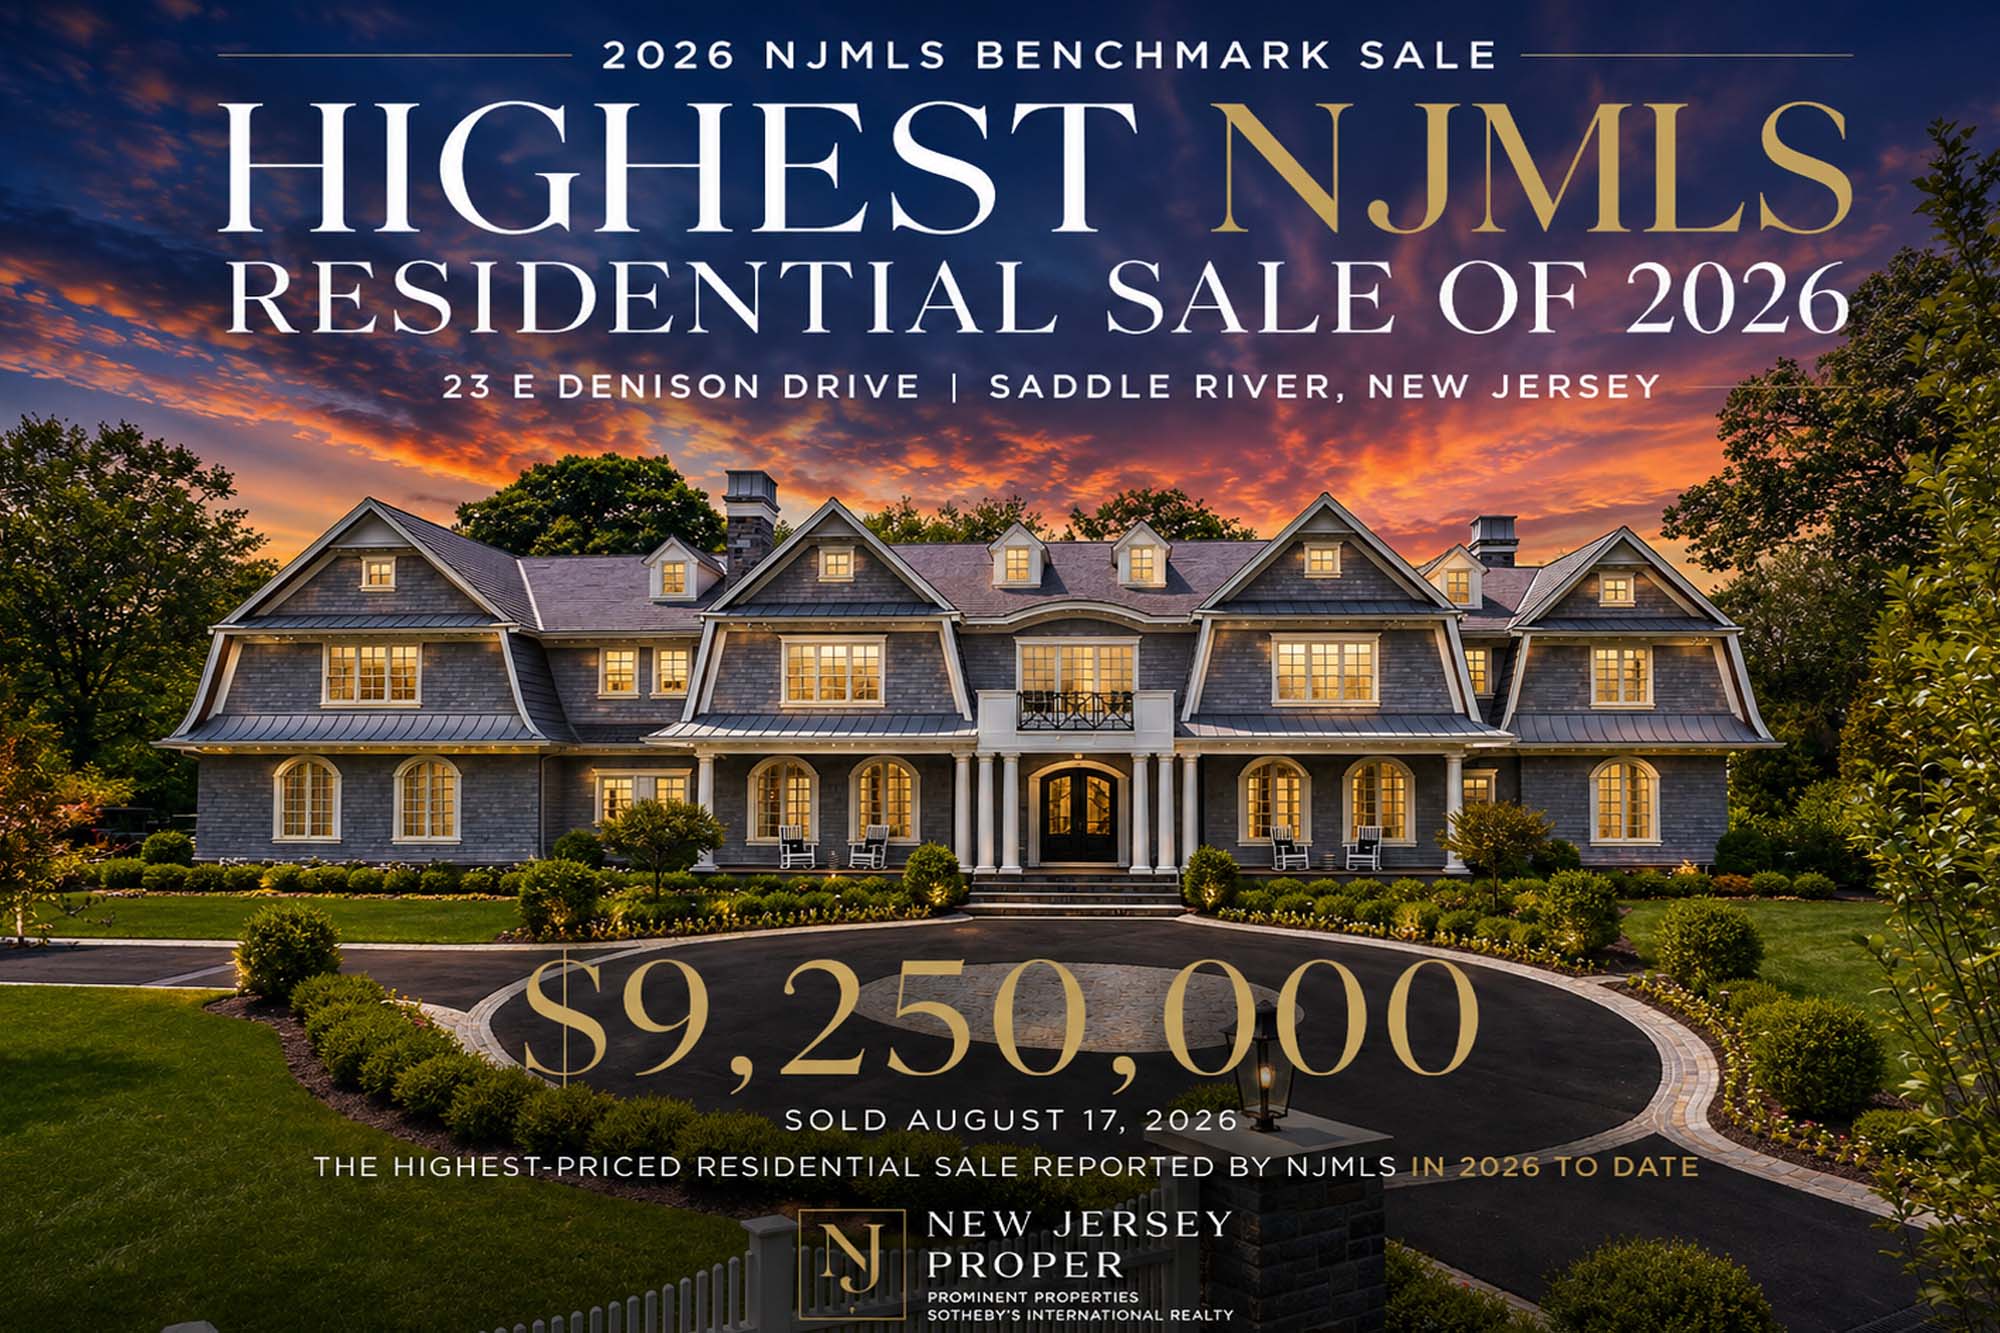
Five Highest-Priced NJMLS Residential Sale…
The $9.25 million closing of 23 E Denison Drive is the highest-priced qualifying NJMLS residential s…

The Northern New Jersey Luxury Price Ladde…
A million-dollar budget can produce very different results across Northern New Jersey. Here is how l…